NASA satellite captures a giant tsunami from space, rewriting science
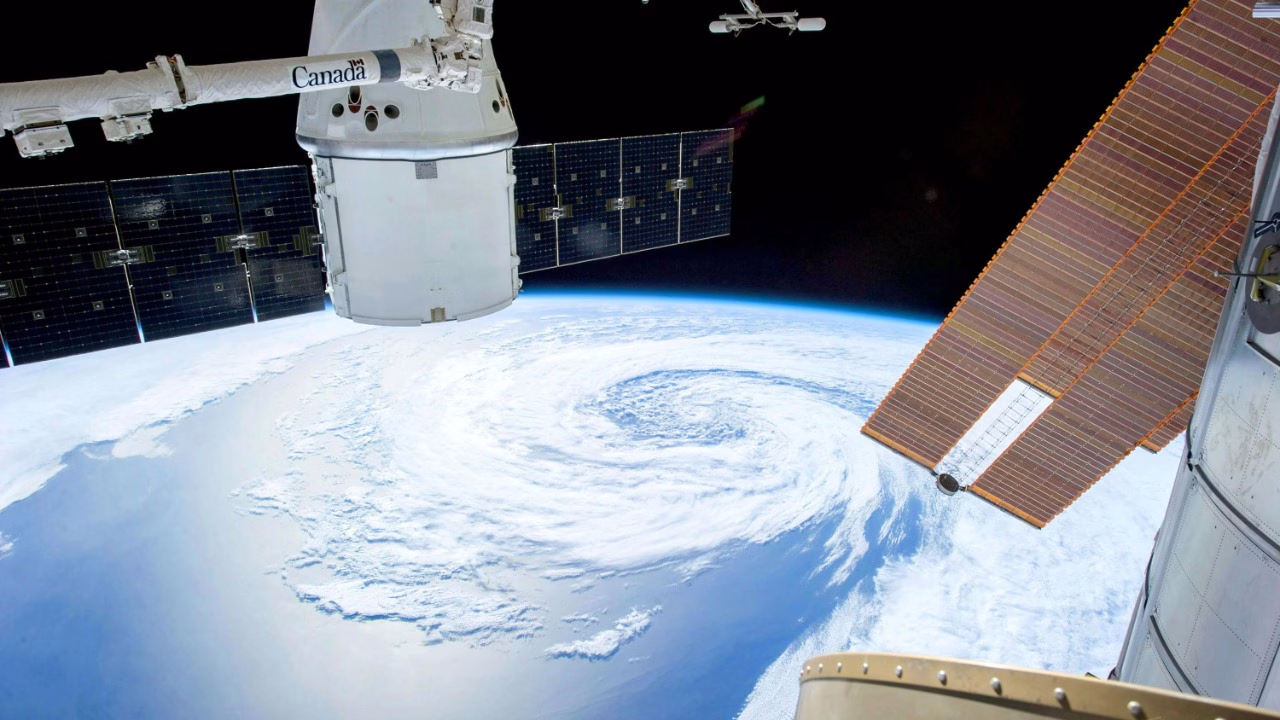
From hundreds of miles above Earth, a NASA satellite has just watched a giant tsunami unfold in unprecedented detail, turning a once theoretical hazard into something scientists can now see and measure in real time. The result is not just a dramatic new image of destruction, but a dataset that is forcing researchers to rethink how tsunamis form, travel, and threaten coastlines across the Pacific and beyond.
By tracking the full life cycle of a wave triggered by a powerful offshore earthquake, the mission has delivered the clearest evidence yet that space-based instruments can map the shape and speed of a tsunami as it races across the open ocean. I see this as a turning point, where orbital measurements stop being a scientific bonus and start becoming a core part of how the world understands and responds to some of its most dangerous natural disasters.
The megaquake that set the Pacific in motion
The story begins with the kind of seismic shock that instantly commands global attention. When a magnitude 8.8 earthquake ripped through the seafloor, it did more than rattle local instruments, it heaved an enormous slab of ocean upward and outward, launching a train of waves that would surge across the basin. That single number, 8.8, captures the raw energy involved, a reminder that the largest quakes do not just shake the ground, they rearrange the ocean itself, as documented in early analyses of the giant tsunami.
In this case, the rupture struck off Russia, near the Kamchatka Peninsula, a region that sits on the volatile edge of the Pacific tectonic ring. When a massive 8.8 m earthquake hit that offshore fault, it instantly put coastal communities around the Pacific on alert, from the Russian Far East to island nations and North American shores. The same event that shook Russia and the Kamchatka Peninsula also created a rare opportunity for scientists, because the tsunami it generated unfolded directly beneath the path of a sophisticated NASA and CNES satellite, as detailed in reports on the Kamchatka Peninsula quake.
How SWOT turned a deadly wave into a data-rich experiment
What transformed this tsunami from another tragic hazard into a scientific watershed was the presence of a new kind of orbital observer. NASA and its French partner CNES had recently launched the Surface Water and Ocean Topography mission, better known as SWOT, to map the height of water surfaces across the planet with extraordinary precision. Instead of relying only on sparse buoys and coastal gauges, researchers suddenly had a satellite capable of scanning wide swaths of the ocean and detecting subtle changes in sea level that reveal the shape of a passing wave, a capability that proved decisive when the tsunami rolled through SWOT’s field of view.
SWOT’s instruments did not just register a single crest, they captured a multidimensional portrait of the tsunami as it propagated, including variations in wave height, wavelength, and structure that had previously been inferred only from models. The fresh, detailed glimpse into the tsunami’s evolution, gathered as the satellite passed over the disturbed waters on July 30, gave scientists a rare chance to compare theory with reality and to refine how they simulate similar events in the future, a leap in understanding highlighted in coverage of the SWOT tsunami data.
A first-of-its-kind overhead view from WASHINGTON to the Pacific
From mission control in WASHINGTON, NASA teams watched as the satellite’s measurements were transformed into the first truly detailed overhead view of a giant Pacific tsunami. For decades, scientists had relied on indirect signs, such as tide gauges and deep-ocean pressure sensors, to reconstruct how these waves behave in the open sea. Now, for the first time, they could see the tsunami’s full footprint across a broad swath of the Pacific, revealing complex patterns of interference and focusing that had only been hinted at in earlier reconstructions.
That vantage point matters because it shows not just that a tsunami exists, but how its energy is distributed as it races outward from the source. The NASA team could trace how the wavefront bent around underwater ridges, intensified along certain paths, and weakened along others, turning the Pacific into a kind of natural laboratory. This overhead perspective, captured as the tsunami spread across the basin, is at the heart of reports describing how a NASA satellite mapped the Pacific in real time.
Inside the science: what the wave revealed about the ocean
Once the immediate drama of the event passed, researchers began to mine the data for deeper insights into how tsunamis actually move through the ocean. The satellite’s high resolution allowed them to see that the wave was not a simple, smooth bulge of water, but a complex pattern of crests and troughs shaped by the seafloor, currents, and even smaller scale eddies. That level of detail is crucial, because it shows where energy concentrates and where it disperses, which in turn affects which coastlines face the highest run-up and strongest currents when the wave finally reaches shore.
Lead scientists working with the SWOT measurements have emphasized that this is not just a prettier picture, it is a fundamentally new kind of dataset that can be plugged directly into numerical models. By comparing the satellite’s snapshot of the tsunami with simulations that start from the known 8.8 m earthquake source, they can test whether their equations correctly capture how the wave interacts with the real ocean. Early analyses suggest that some long-standing assumptions about how tsunamis behave in deep water, including how they break into different “packets” of energy, need a revision in light of the satellite’s precise mapping of the tsunami’s structure.
Ángel Ruiz-Ángulo and the Seismic Record rethink tsunami risk
One of the most influential voices interpreting this event has been Ángel Ruiz-Ángulo, a seismologist whose work sits at the intersection of earthquakes and ocean dynamics. As Lead author of a report in Seismic Record, Ruiz-Ángulo of the University of Iceland has argued that the SWOT observations provide a kind of missing link between what seismometers record at the source and what tide gauges measure at the coast. By filling in the vast oceanic gap between those two points, the satellite data help explain why some earthquakes produce unexpectedly large tsunamis while others do not.
Ruiz and his colleagues have focused in particular on how the tsunami’s shape and speed, as seen from space, can be used to refine estimates of which communities are most at risk after major earthquakes. Instead of relying solely on the quake’s magnitude and location, they envision a system where real-time satellite snapshots of the wave feed directly into hazard models, updating forecasts as the tsunami evolves. That vision, grounded in the new SWOT measurements, is central to the analysis presented by the Lead author Ruiz and echoed in related coverage of the University of Iceland team.
From Russia’s Kamchatka Peninsula to global coastlines
Although the earthquake that triggered this tsunami struck off Russia’s Kamchatka Peninsula, the consequences and the scientific lessons extend far beyond that remote arc of land. The event underscored how a single rupture in the northwest Pacific can send waves racing toward Alaska, Japan, Hawaii, and the west coasts of the Americas, sometimes with little more than a few hours of warning. For emergency managers, the ability to see the tsunami’s actual shape in the open ocean, rather than inferring it from sparse instruments, could be the difference between overestimating or underestimating the threat to specific harbors and bays.
The satellite’s view also highlighted how regional geography can amplify or dampen the impact of a wave that began off Russia. As the tsunami spread across the Pacific, its energy was funneled along certain paths by underwater ridges and trenches, creating hot spots of higher wave amplitude that might not be obvious from the earthquake’s location alone. That pattern, captured in the first high resolution image of the event, is a vivid example of how a powerful earthquake off Russia’s Kamchatka Peninsula can generate a massive Pacific tsunami whose behavior only becomes fully clear when seen from above, a point emphasized in reporting on the Pacific tsunami image.
Why this changes tsunami warning systems
For decades, tsunami warning centers have relied on a combination of seismic data, deep-ocean pressure sensors, and coastal tide gauges to decide when to issue alerts and how severe those alerts should be. That system has saved lives, but it also has limitations, especially in the early minutes after a major quake when the true size and direction of a tsunami are still uncertain. The new satellite observations suggest a path to closing that gap, by adding a global, overhead view that can confirm or correct initial estimates as the wave travels.
In practical terms, I see three major implications for warning systems. First, satellites like SWOT can help distinguish between earthquakes that displace large volumes of water and those that do not, even if they share similar magnitudes. Second, by mapping the tsunami’s actual height and structure across the ocean, they can identify which coastlines are likely to see the highest run-up, allowing more targeted evacuations. Third, the data can be used to validate and improve the numerical models that underpin every forecast, reducing the risk of both false alarms and missed threats. These operational stakes are woven through the analyses that describe how a NASA satellite view can reshape how agencies assess who is at risk after major earthquakes.
Rewriting the textbooks on tsunami physics
Beyond immediate warning applications, the Kamchatka event is already prompting scientists to revisit some of the core assumptions that have guided tsunami research for decades. Traditional models often treat these waves as relatively simple, long-wavelength disturbances that move through deep water without changing shape very much. The SWOT data, by contrast, reveal a far more intricate picture, with the tsunami’s energy breaking into distinct packets, interacting with background currents, and responding sensitively to variations in seafloor topography.
That complexity does not make tsunamis less predictable, but it does mean that accurate forecasts require more detailed physics than many operational models currently include. I expect that future textbooks will use this event as a case study in how high resolution satellite altimetry can expose the fine structure of tsunami propagation, forcing a shift from idealized theory to data-driven realism. The fact that a single pass of a satellite could capture so much nuance in the wave’s behavior is precisely why researchers now argue that some long-held ideas about tsunami “simplicity” in deep water need to be updated in light of the SWOT observations.
What comes next for NASA, JPL, and global tsunami science
For NASA, JPL, and Caltech, the Kamchatka tsunami is both a validation of years of engineering and a preview of what future missions might deliver. The SWOT satellite was designed primarily to study rivers, lakes, and ocean circulation, yet it has now proven its value as a disaster science tool, capturing a phenomenon that unfolds on timescales of minutes to hours. That success will likely strengthen the case for maintaining and expanding a fleet of satellites capable of similar measurements, so that the next great tsunami, wherever it originates, will not pass unseen across the open ocean.
Globally, I expect the ripple effects of this event to extend into how countries coordinate on tsunami research and warning. Agencies that once focused mainly on ground-based sensors may now look to integrate satellite data streams into their operational workflows, while academic teams will mine the SWOT archive for other transient events hidden in its records. The collaboration between NASA, JPL, Caltech, and international partners that produced this first detailed look at a tsunami from space has set a new benchmark for what is possible when orbital technology and hazard science intersect, a benchmark that future missions will be measured against as they continue to refine our understanding of how the ocean responds when the Earth’s crust suddenly shifts.
More from Bisakimia

- 6 Makanan yang Bisa Menyebabkan Ketombe - December 16, 2025
- Why your microwave might be ruining your food, according to science - December 16, 2025
- Rachmatul Karimah Berbagi Ilmu Melalui Buku - December 16, 2025


Leave a Reply